Data Discovery: 3 Essential KPIs to Track to Optimize Your Data Product Marketplace
Effective data search and discovery is a key driver of performance on any data product marketplace. Yet without relevant metrics, it is difficult to understand what is really working. Discover the 3 essential KPIs to track to optimize the search experience and maximize the value of your data products.

Both data volumes and the number of tools in the tech stack are growing rapidly. But are they actually being used? A dataset can be extremely valuable, but if it is not easily discoverable in the right tool or doesn’t show up in search results, its potential remains untapped.
Inspired by e-commerce sites, data marketplaces rely on clear metrics to ensure that every asset is visible, understandable, and usable. This article outlines the three essential key performance indicators (KPIs) to focus on in order to maximize the search performance and impact of your data.
What is a data marketplace?
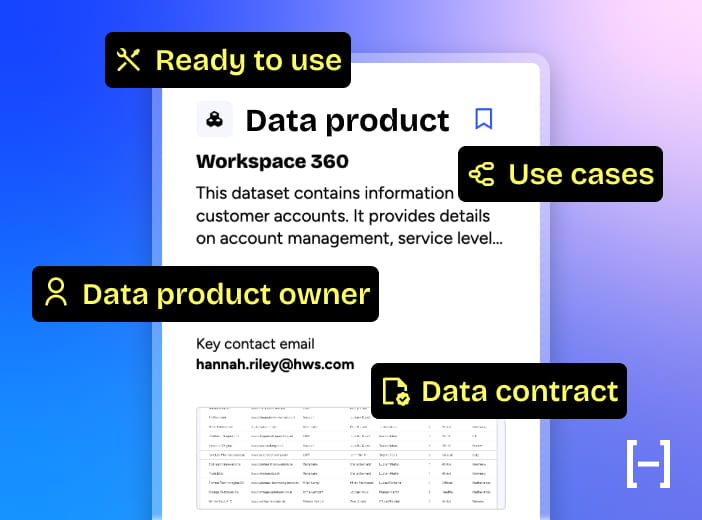
A data marketplace is a self-service solution that optimizes access to, understanding of, and usage of data by non-technical users, while enabling data teams to measure usage. It is a strategic piece of data infrastructure that works with the other tools in the data stack, delivering large-scale data consumption and acting as the last mile access that transforms packaged data assets into value drivers.
Why is it critical to measure the impact of your data?
In a world of growing noise, accurate data is a critical, reliable source of truth. This means that as data volumes grow, measuring actual data usage becomes essential to support sound decision-making. A data marketplace plays a central role by structuring, enriching, and making data visible. It also promotes best practices such as clear metadata and descriptions, making data easily discoverable and understandable for all users.
3 essential KPIs to improve data usage on your data marketplace
1. Click-Through Rate (CTR)
What is it and why is it important?
The click-through rate (CTR) measures the percentage of users who click on a data asset after seeing it in the catalog’s search results. It is a key indicator of interest and relevance: a high CTR shows that users find the asset useful and aligned with their needs.
How is it measured and what target should you aim for?
The CTR = (Number of clicks on a data asset in the catalog / Number of impressions of the asset in search results) x 100 to create a percentage
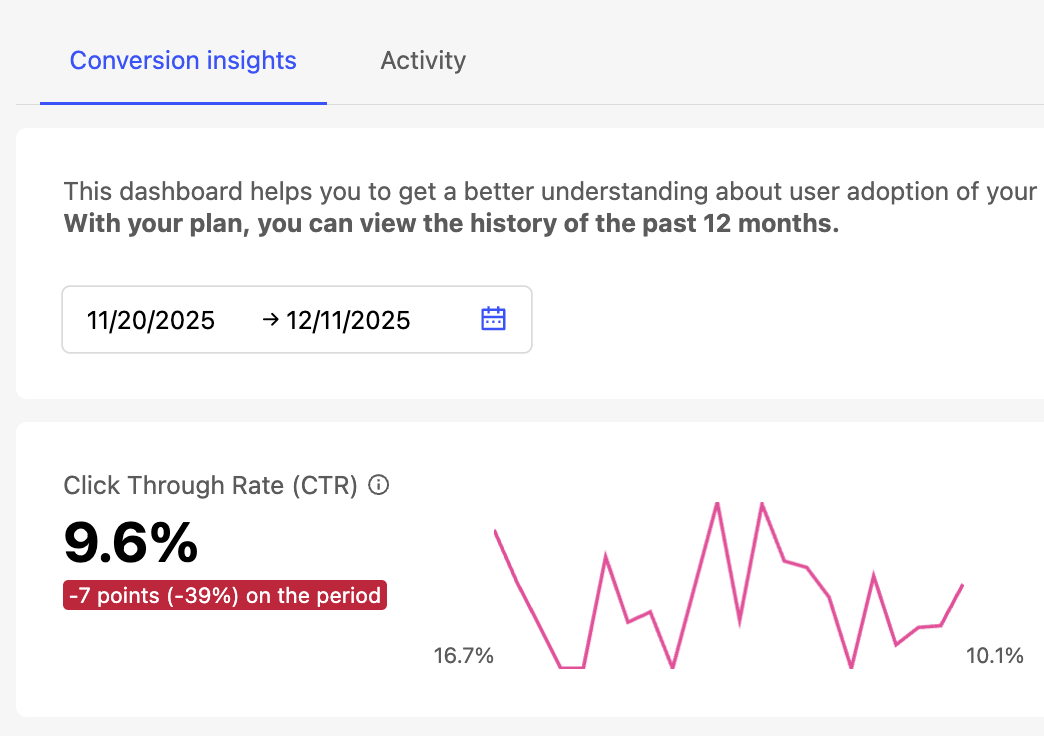
A rate between 15%-25% is generally considered good. If the rate is below 10%, the relevance of the data asset or how it is presented should be re-evaluated.
How can it be improved?
There are four key ways to increase the CTRs on your data assets and improve their search engine visibility::
- Ensure the asset addresses a real, clearly-identified business need
- Write clear, explicit titles focused on user needs
- Add comprehensive, transparent metadata
- Add an engaging thumbnail (data assets with visuals attract significantly more clicks in the data catalog)
Real-world example:
Imagine a data asset titled “Sales by region.” If it is hard to identify, understand, or is not visually appealing, its CTR will remain low. By renaming it “Revenue by Region – 2025 Data,” the asset immediately becomes clearer for business users looking for recent data, naturally encouraging them to click to learn more.
2. Average Click Position
What is it and why is it important?
The average click position indicates which results users click on in the search engine. A high ranking means that the most relevant information appears first, reflecting strong search engine performance and an effective user experience.
How is it measured and what target should you aim for?
It is calculated as the average or median position of all clicked results. The aim should be for users to find the most relevant results at the top of the search results page.
How can it be improved?
Two levers can help enhance the average click position of your data:
- Optimizing data indexing
- Enriching and better structuring metadata
Real-world example:
Suppose that for the query “Customers by segment,” clicks occur on average on the 12th result in the catalog. By enriching metadata for the most relevant assets for this query—by rephrasing descriptions or adding a theme—their average position can improve. Users then find relevant data more quickly thanks to better visibility in the search engine results.
3. Zero-Click Search Rate
What is it and why is it important?
The zero-click search rate covers popular searches that do not result in any clicks on relevant results. It helps identify two types of issues:
- Lack of relevant content: no content meets the expressed need, indicating an opportunity to create new assets.
- Poor visibility of existing content: content exists, but metadata, descriptions, or indexing do not match search queries, limiting its visibility in the catalog.
Analyzing this metric helps determine whether new content should be created or existing assets improved to better meet user needs.
How is it measured and what target should you aim for?
Zero-click search rate = (Number of searches without clicks/Total number of searches) x 100 to create a percentage
This rate should be as low as possible. Based on e-commerce standards, a rate between 20% and 35% is considered normal. Above 45%, it is worthwhile reviewing and optimizing the results offered through searching the catalog.
How can it be improved?
To reduce the zero-click search rate, it is important to complete or correct missing content, optimize indexing, and improve result relevance. Enhancing the search process will improve the overall experience on your data product marketplace.
What is the difference between average click position and zero-click searches?
Average click position focuses on where users click within existing results, while frequent zero-click searches focus on queries that generate no clicks at all, even when results are displayed. These two indicators are complementary – both are essential for evaluating data visibility and overall search effectiveness in a data marketplace.
Delivering the right data in response to the right queries to maximize impact
As in e-commerce, a product’s success depends on both its quality and its visibility. This means that when it comes to data, search engine visibility determines whether it is used at scale. Monitoring search performance through KPIs therefore helps identify what works, fixes friction points, and ensures users can quickly find relevant data.
The Huwise data marketplace underpins this approach by automatically tracking these KPIs for each data asset. It enables teams to understand exactly where issues arise and act effectively, with a clear objective: delivering the right data to answer the right queries to maximize usage and value creation from data.
Want to improve your data performance and better measure its impact? Contact us to discover how Huwise can help.
Share this post:
Articles on the same topic:
About the author

As Huwise’s Product Marketing Manager, Pauline Plancke is focused on continually exploring, analyzing, and communicating the latest innovations in our solution.
More articles