Data visualization
Our data portal solution makes it easy for everyone, from data experts to business users, to easily create compelling data visualizations, making your data understandable and reusable at scale.

Easily create [ data visualizations ] with our No-Code Studio
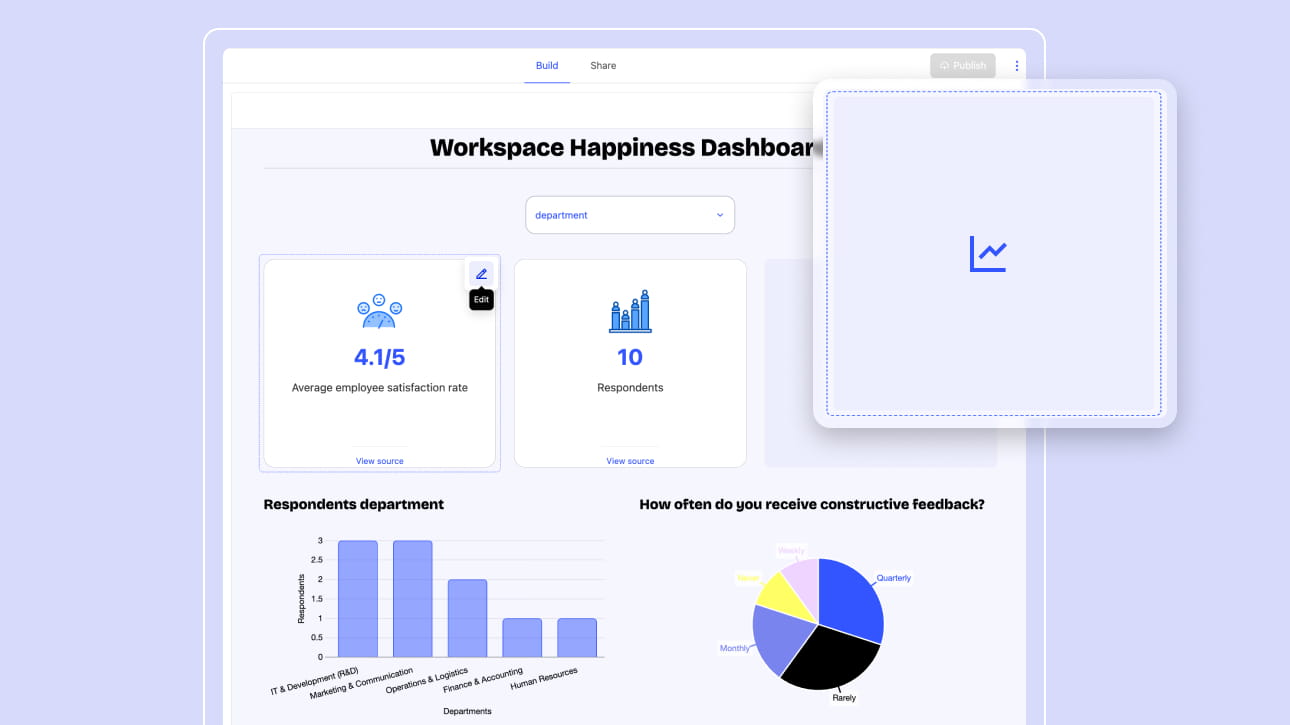
Design memorable data visualizations in minutes with Huwise’s No-Code Studio, which is designed to simplify the creation of data stories, maps, performance monitoring dashboards, and KPI reports.

No-code interface
Organize your content blocks through drag and drop, configure your visualizations with your mouse and enter text directly onto the page with our WYSIWYG editor.

Real-time preview
Every action you take is visually reflected on your page. You can see progress immediately without ever needing to refresh your browser.

100% responsive
Data visualizations created with Huwise automatically adapt to fit all screen sizes, making dashboards and data stories available to mobile devices of all types.

Creation of various contents
The no-code studio allows you to integrate and generate, in one click, a wide variety of blocks such as point of interest maps, choropleth maps, indicators, graphs, and even tabular views of datasets, to create customized data visualizations
Accelerate the creation of data visualizations with AI
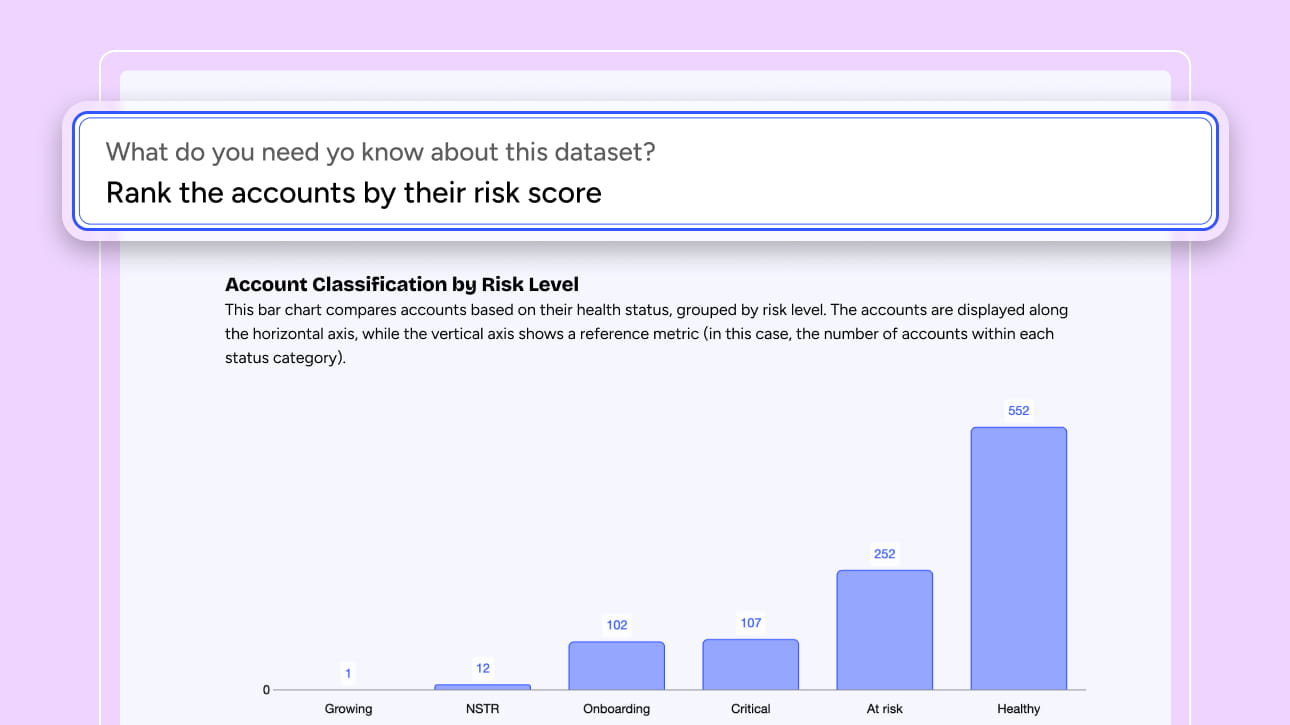
Save valuable time by creating your data visualizations with our AI-based virtual assistant. It automatically generates a variety of blocks, including maps, indicators and graphs, just by responding to your natural language questions. Creating data visualizations has never been easier or more accessible.
Create advanced data visualizations with code editor
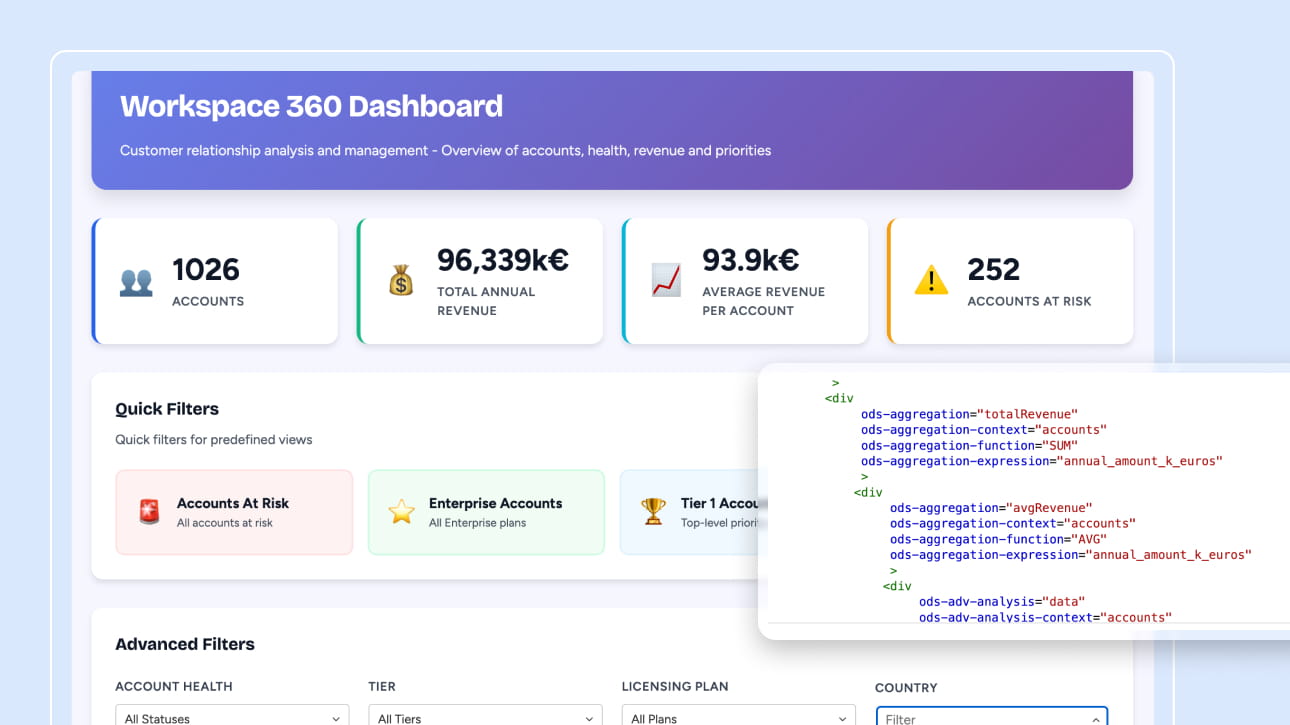
Use our versatile code editor to design a range of pages, from data visualizations to editorial pages on your data portal. It provides the same flexibility and customization options as common website editing tools.
Fully Customizable
With the code editor, you have total flexibility when creating pages.

Sources of Inspiration
The code editor offers a comprehensive library of templates and sources to inspire you, providing a range of options for both structure and content.

Advanced Customization Options
Customize block and section layouts, adjust color palettes, choose typography, access a free icon bank, manage button styles, and select backgrounds to create a unique user experience.

"The Huwise platform allows our community to create their own visualizations and slice and dice the data any way they choose. Commencing with localized weather data and parking data, Southern Grampians Shire Council will continue to add datasets to this user-friendly community portal."

474% ROI in less than 6 months with Huwise's data product marketplace
Discover how Huwise helps business users spend half as much time searching for data, and data teams cut data preparation time in half - freeing everyone to focus on what matters: turning data into insights.
Learn morereduction in time spent searching for data
reduction in data preparation time
reduction in data duplicated work
per year saved for IT

FAQ
-
Data visualization is a graphical representation of raw data that transforms it into clear, actionable information. Choosing the right visualization depends on the objective, the type of data being presented, and the target audience. To maximize the impact of visualizations, it is essential to design them thoughtfully, taking into account the specific characteristics of the data and the needs of users.
-
To unlock the value of your data, data visualization transforms raw data into easy-to-understand visual representations. By using dashboards and data stories, you can make your data more accessible, improve decision-making, and foster new use cases through clear, shared insights.
-
Huwise includes an AI-powered virtual assistant that can automatically generate visualizations (maps, charts, and indicators) from natural language queries.
Users simply describe what they want to see, and the AI instantly creates the visualization.
- This drastically reduces the time between raw data and a published, shareable visualization.
- The process becomes accessible even to users with no prior experience with data visualization tools.
- It accelerates users’ time-to-insight on a data product marketplace.
-
For full creative and technical control, the integrated code editor enables:
- Full customization of the layout of blocks and sections.
- Fine-tuned adaptation to your brand guidelines, including colors, typography, and button styles.
- Access to an icon library and templates to accelerate the creation of complex pages.
This flexibility is comparable to standard CMS tools used to build websites.
-
Yes. All visualizations—whether created using the no-code studio, AI, or the code editor—are 100% responsive.
- They automatically adapt to all screen sizes, including desktops, smartphones, and tablets.
- Dashboards, data stories, and interactive maps remain fully functional and visually consistent across devices.
- This is particularly important for public portals and open data initiatives, where a significant portion of the audience accesses content from mobile devices.