Veolia transforms IoT data into high value-added insights through Dashboards as a Service offering
Connected objects
Data points analyzed / day
Client cities
Company profile
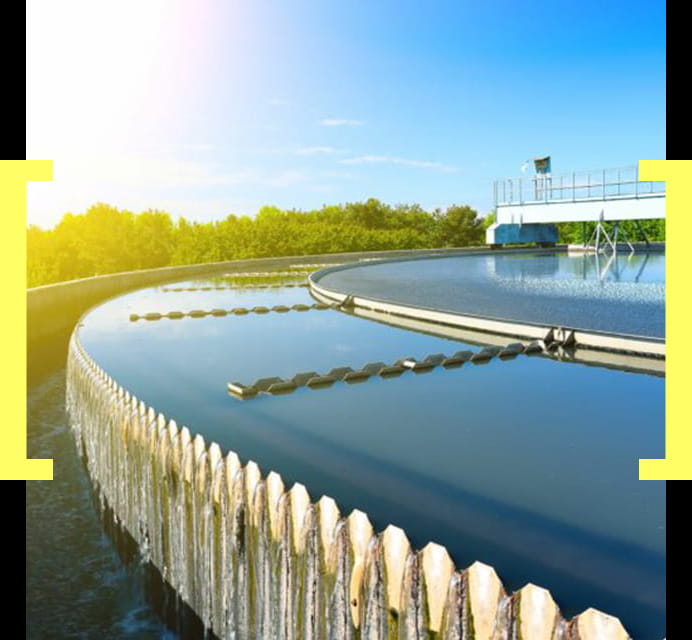
A pioneer in smart water solutions, Veolia currently has three million connected devices in operation with multiple smart water networks deployed across Europe. Veolia deploys its unique knowledge to serve the smart city and the environment. Its Internet of Things (IoT) sensors collect millions of data points every day and make it possible to analyze environmental issues related to water, energy, air, waste and biodiversity.
Sector
Utilities & energy
Location
France
Data leader

Challenges: Creating a dashboards as a service offering
To enable water company and local authority employees who are not familiar with data analysis to understand this sensor data and interact with it, we wanted to develop a Dashboards as a Service offering to complement our existing products.
Our objective is to enrich our range of IoT sensors and generate new sources of revenue by providing dashboards that allow customers to monitor their activities, increase their operational efficiency, optimize their resources and improve their profitability.
"We have moved from having a vision of becoming a data provider to delivering a complete offering to clients. We don’t just sell sensors, but also provide customers with access to high added value data that can be understood by everyone and that allows for improved innovation and management."
Data experience: Integrating management dashboards with Veolia's IoT solution
At Birdz by Veolia we design innovative and industrial IoT products to support cities, regions and industries in their activities. These include:
- KAPTATM sensors to analyze drinking water quality
- SWARM sensors to measure water quality in surface water (rivers and lakes) to monitor for potential
pollution risks - Apiink sensors to monitor the activity of fire hydrants and to measure their usage.
- Leko sensors to listen to and monitor biodiversity and the impact of human activity on it.
Leko
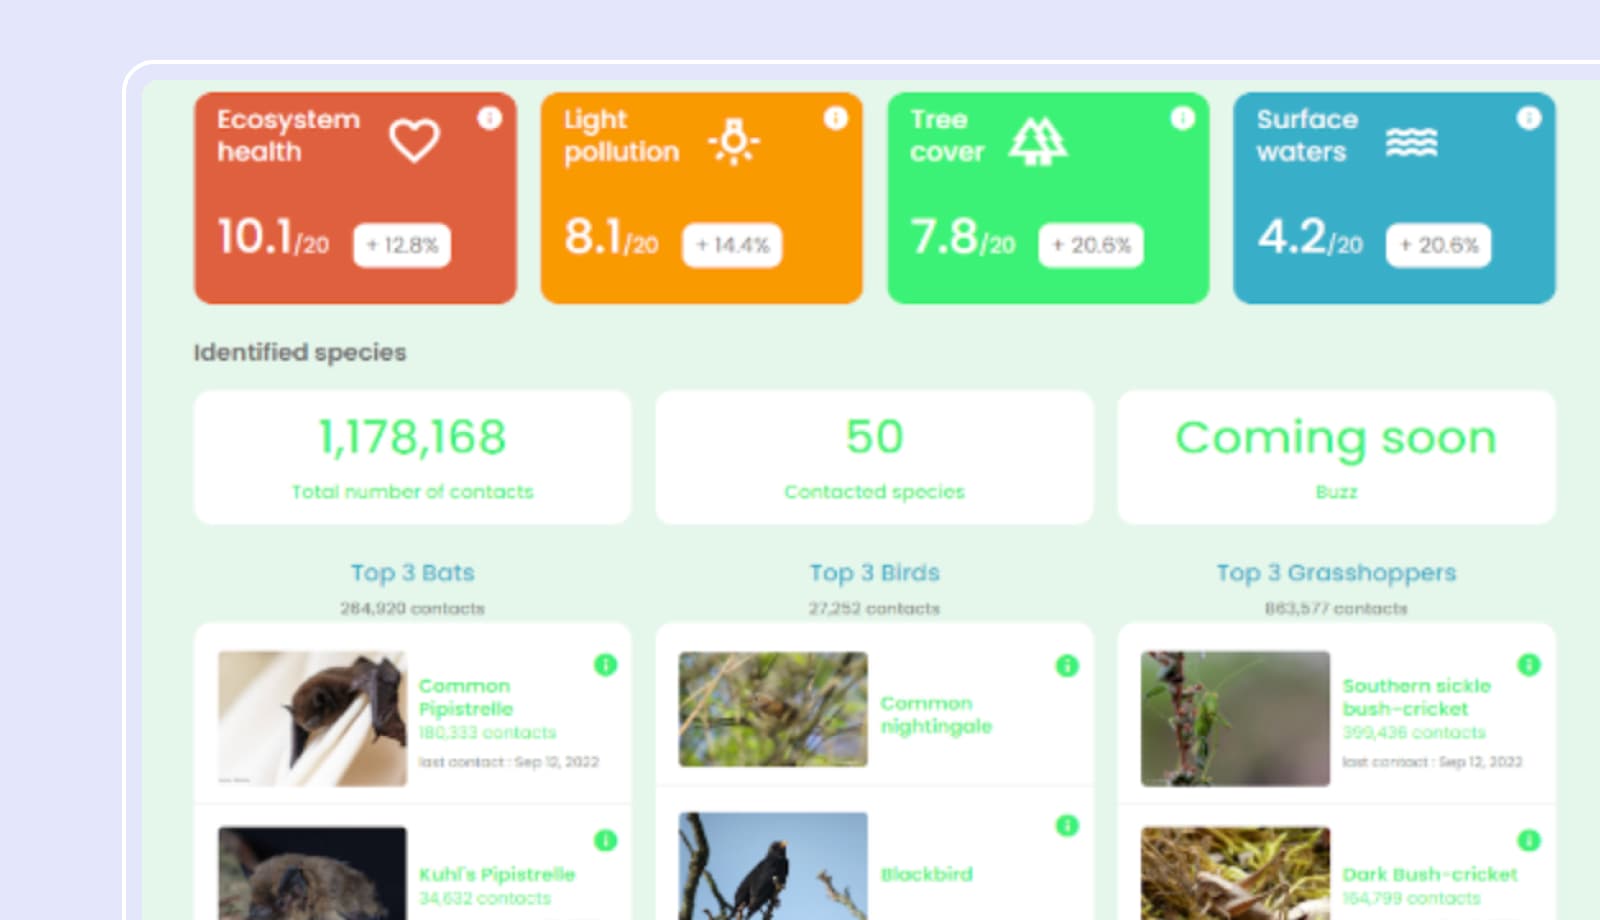
- Eco health indicators (light pollution, vegetation cover, water quality)
- Top 10 species identified (including bats, birds, butterflies, and grasshoppers)
- Community-based for knowledge exchange and improvement
- Ability to hear and see the animals identified via the dashboard
We wanted to create interactive dashboards and data visualizations to transform the data from users’ IoT sensors into concrete insights. When customers subscribe to one of these services, they now have access to a complete Dashboard as a Service management tool that allows them to increase their operational efficiency by monitoring business data and instantly detecting points of failure and contamination, whether intentional or accidental, in their pipeline networks.
Through our dashboard services, we want to bring innovative solutions to its customers. To help them adopt pro-environmental policies and approaches, we provide multiple, heterogeneous data sets, synthesized into clear decision-making information. This expertise can be broken down into two key aspects:
- Data enrichment and analysis: Our internal teams select relevant data and analyze it to create information that can trigger user actions. This data is enriched with meteorological and water network data to provide context.
- The creation of data visualizations: users of our data services are not necessarily familiar with data analysis. Data visualization allows data to be converted into understandable, contextualized information for all users.
Now we are becoming increasingly data-driven, we are also developing other use cases around data to improve internal efficiency:
- An interactive dashboard to manage ongoing or completed interventions. Workers in the field are equipped with an app that allows them to take photos and complete reports, which are then formatted on the dashboard.
- An interactive dashboard which transforms our database of drinking water samples, making it easy to view data that represents 25,000,000 entries in a traditional file.
- A dashboard to monitor the organization’s main KPIs and overall objectives.
As an organization we are now benefiting by providing our customers with greater operational efficiency through monitoring usage data and instantly detecting points of failure and issues in networks. Our digital solutions enable municipalities and utilities to improve management of their assets and make better decisions.
Huwise: the foundation of Veolia's data experiences
In order to expand our offering and include a dashboarding service for customers, we needed a technological solution that could be deployed very quickly and that would allow it to create customized dashboards with high value-added indicators for each customer.

Connection to all data sources
Our teams have to handle a wide variety of data sources, particularly from over 3,500 IoT sensors. The connectors and APIs provided by Huwise allow us to automatically connect to all these sources in order to guarantee a reliable service to users.

Data enrichment
In order to provide relevant analysis on the data generated across its customers’’ water networks, we use the repositories and public datasets provided by Huwise. These data cross-referencing tools allow users to contextualize information and identify insights with high added value.

Creation of interactive dashboards
With Huwise, we can create interactive data visualizations and combine them to provide thematic dashboards linked to different IoT sensors, all without any advanced technical skills.

Permission management
Huwise allows you to manage the access rights to the data presented on the dashboards. Instead of creating a dashboard for each client, we can set permissions. This avoids duplication and saves time and money while ensuring optimal security.
Results: a new data monetization model
The Huwise platform has allowed us to significantly reduce the time to create our Dashboard as a Service offerings and to industrialize them to meet the growing demands of our customers. It is now a source of revenue in its own right for which we have precise monitoring KPIs.
Thanks to the implementation of customized dashboards,we can now offer an innovative service that means we stand out from the competition. Dashboard as a Service projects can be launched quickly and deployed on a large scale, able to tap into our infrastructure – we manage more than 3,500 connected objects that provide updates around every 5 minutes.
Our Dashboard as a Service is available as a subscription service and we monitor a number of KPIs to analyze:
- Revenues generated by the project
- Sales
- Integration in tenders
- Adoption of new digital services
- Deployment
- Users
- Environmental impact
- Through species impact analysis

"The Dashboard as a Service solution implemented by Birdz Veolia is the perfect example of how data can be used in an innovative way to create new sources of revenue. By creating these data services tailored to each customer and their needs the company is able to use its insight and experience to boost profitability. This example demonstrates that any organization creating high value-added data can replicate this approach - and its benefits - very easily."
About the Data leader
Guillaume Fabre
Head of Data and Innovation, Veolia
Guillaume Fabre is Head of Data and Innovation at Veolia.