Veolia transforms IoT data into high value-added insights through Dashboards as a Service offering
Connected objects
Data points analyzed / day
Client cities
Company profile
Veolia’s Connected Solutions division (formerly Birdz) designs and deploys Internet of Things (IoT) solutions to support the management of water, environmental resources, and infrastructure. Originally focused on the remote reading of water meters, the business has gradually expanded to address broader environmental monitoring challenges, ranging from drinking water quality to biodiversity tracking.
Sector
Utilities & energy
Location
France
Data leader

This evolution has been accompanied by a shift in focus. Data is no longer used solely to generate dashboards for customers. Instead, it has become an asset for directly managing operations and infrastructure.
Challenge: structure and leverage massive volumes of complex, scattered data
With several million sensors deployed in the field, Veolia’s Connected Solutions business manages vast volumes of data generated by multiple, diverse sources.
The challenge to extracting value isn’t just because of the sheer scale of our data, but is also due to the complexity of the entire IoT ecosystem. We have to manage sensor reliability, transmission network quality (radio, 4G, etc.), varying coverage levels, and a wide range of data formats.
This is further compounded by the coexistence of numerous data sources, including sensor data, network data, operational data, contractual information, and open data. Historically, these datasets were scattered across different systems, making cross-functional analysis and utilization difficult.
Based on this, we came to a key realization. Simply having data is not enough. Our customers must also be able to combine, interpret, and effectively apply that data to support operational decision-making.
“We quickly realized that just having data was not enough. We needed to know what to do with it, how to combine it, and above all how to make it useful for the customer.”
The challenge became clear: we had to move from a data collection mindset to one where we utilized data operationally.
Data Experience: structuring data to drive operations and enable new use cases
To address these challenges, Veolia Connected Solutions relies on a data product marketplace that centralizes all its water quality and biodiversity data, regardless of format or source. This platform transforms raw data into data products that can be directly used by operational teams.
Integrating operational dashboards into Veolia’s IoT offering
Veolia’s Connected Solutions division designs innovative industrial IoT products to support cities, regions, and industrial operators:
- KAPTA™ sensors to monitor drinking water quality
- SWARM sensors to measure surface water quality (rivers and lakes) and prevent pollution risks
- Apiink sensors to monitor fire hydrant activity and track water consumption
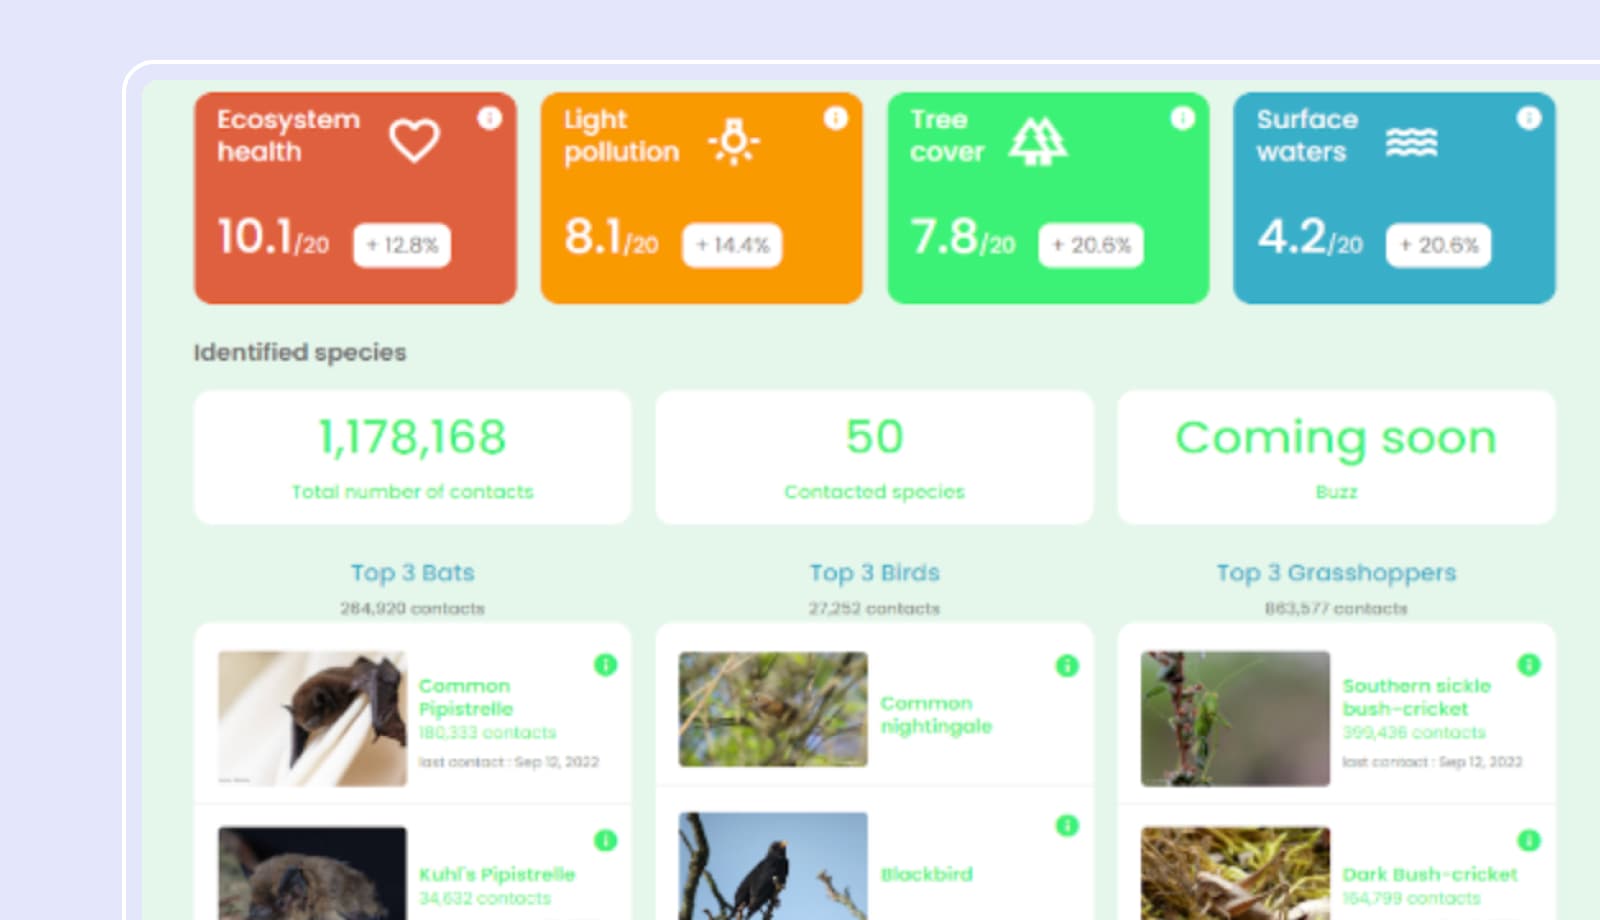
- Leko sensors to monitor biodiversity and assess the impact of human activity on the environment
We have developed interactive dashboards and data visualizations to transform IoT sensor data into actionable insights. When clients subscribe to these services, they gain access to a comprehensive operational tool that enhances their efficiency by monitoring key data and instantly detecting failures and contamination events—whether accidental or intentional—in water distribution networks.
Beyond dashboards, our goal is to deliver innovative solutions to our clients. By providing diverse and heterogeneous datasets, we help clients adopt more sustainable and environmentally responsible policies through clear, decision-ready information. This expertise is built around two core pillars:
- Data enrichment and analysis: our teams select and analyze relevant datasets to turn them into actionable information. Data is also enriched with contextual sources such as weather or water network information to improve interpretation and relevance.
- Data visualization creation: Since users are not always data experts, being able to provide visualizations is essential, translating complex datasets into clear, contextualized insights accessible to all business functions.
We have been recognized for our ability to improve operational efficiency by continuously monitoring usage data and instantly detecting failures and anomalies in water infrastructure networks. These digital solutions enable municipalities and public utilities to better manage their assets and make better-informed decisions.
A business application at the heart of operations
Using our data, we have implemented an internal management application that enables end-to-end monitoring of the IoT chain.
Through advanced dashboards and mapping tools, our teams can track all sensors and contracts managed by our department.
By aggregating sensor data, network performance metrics, and theoretical coverage models, our teams are now able to continuously analyze infrastructure performance and quickly identify the root cause of any malfunction.

“We needed end-to-end monitoring, from the sensor all the way to final metrics in order to ensure we are operating effectively at every step.”
A data product approach that serves business teams
Data is no longer merely stored or analyzed on an ad hoc basis. It is structured into ready-to-use building blocks that are directly consumable by operational teams.
Each piece of information—whether coming from sensors, network systems, or business applications—can be easily reused across multiple tools and applications, without needing to be processed separately every time.
This approach helps save time, eliminates redundancy, and enables the rapid development of new use cases built on a structured and reliable data foundation.
Huwise: the data experience backbone for Veolia Connected Solutions when monitoring water quality and biodiversity

Interactive dashboard creation
Huwise enables data to be explored through visual interfaces, particularly map-based views. Teams can visualize sensors, theoretical radio network data coverage, and actual performance on a single map, and analyze gaps between expected and observed behavior.
This visual approach makes it possible to q

Direct operational data use
Data is used daily to monitor, analyze, and resolve operational issues. Teams track message throughput, analyze transmission losses, and trace incidents back to their root causes by identifying the network components involved.
The platform also automatically calculates performance against SLAs and contractual metrics, helping anticipate issues and potential penalties based on actual data collection performance.

Access and permission management
Huwise provides robust access controls for dashboard data. Instead of creating separate dashboards for each client, permissions can be configured dynamically, saving time and cost while ensuring a high level of security and data governance.

Connectivity with all data sources
Our teams work with a wide variety of data sources, including more than 4,000 different IoT sensors. Huwise connectors and APIs enable automatic integration of all these sources (CRM systems, business tools, cloud data platforms), ensuring a reliable and unified service for users.
Results and impacts
Data is now used as a key tool for operational decision-making and performance management.
Teams benefit from a unified view of the entire IoT chain and can respond more quickly to anomalies by accurately identifying their root cause.
The platform also breaks down data silos, which previously saw information scattered across multiple systems. It makes data available and usable within a common, centralized environment. This harmonization enables a cross-functional view of operations that was previously difficult to achieve.
This continuous analytical capability helps us to:
- improve infrastructure reliability and service quality
- ensure compliance with contractual commitments
- reduce the time needed for diagnosis and intervention
Simplified access to data is also transforming ways of working: business teams can directly use the information they need without relying on data experts to prepare it for them.
Finally, structuring data into data products enables the rapid deployment of new use cases, built on an existing and industrialized foundation.
“The “Dashboard as a Service” solution developed by Veolia’s Connected Solutions division is the perfect example of how data can be used in an innovative way to create new sources of revenue. The company’s knowledge is effectively monetized by creating new data services tailored to each customer’s specific needs. This example demonstrates that any organization creating high value-added data can replicate this approach - and its benefits - very easily.”
Outlook: driving adoption and expanding use cases
The project is now entering a new phase.
After structuring access to data and deploying initial real-world use cases, our focus is now shifting toward embedding these tools into day-to-day operations and scaling their adoption across teams.
The goal is to continue enriching existing applications, develop new ones from the same foundational building blocks, and further leverage available data without creating new silos.
In parallel, we are exploring new ways of querying and analyzing data, particularly through approaches that integrate artificial intelligence, with the aim of accelerating analysis and improving the speed of problem identification.
“The challenge now is to go further in terms of analysis and make even better use of data, particularly with AI.”
Our overarching objective remains unchanged: to continue leveraging data to drive day-to-day operations, through simple, field-ready tools that deliver immediate value on the ground.
About the Data leader
Guillaume Fabre
Head of Data and Innovation, Veolia
Guillaume Fabre is Head of Data and Innovation at Veolia.
Let’s talk [ data product marketplace ]
In just 30 minutes, discover how Huwise helps you create value for everyone across your organization. Book your personalized demo with one of our experts and let us explain more.
Demander une démo